Introduction
Using ‘top’ will give a real-time overview of what is using system resources on your Cloud Server.
Easy configuration and a simple interface allow you to change the emphasis of the summary. For example, choose to concentrate on CPU use or memory use.
Let’s start by giving the ‘top’ command:
# top
Full output
If you’ve never seen a system stats output before then you may be in for a surprise:
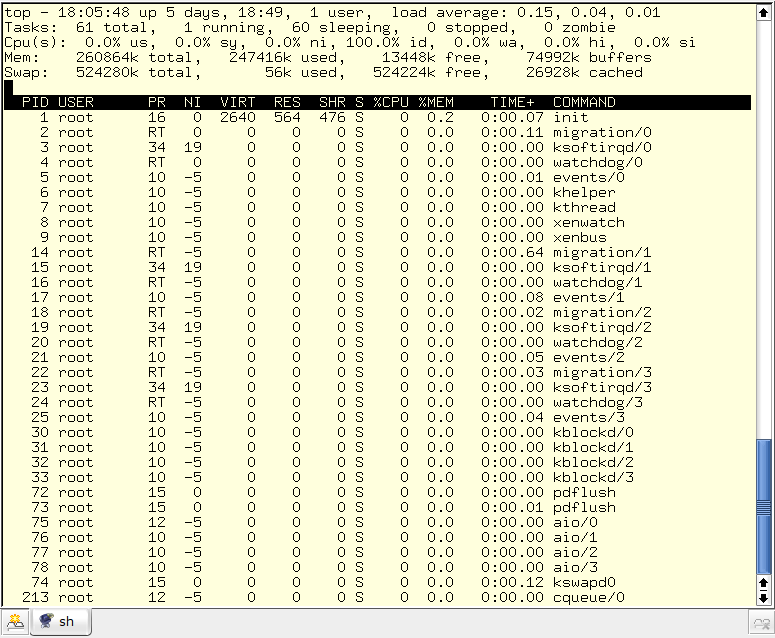
Once you get used to a console full of changing numbers (by default top updates itself every 3 seconds) you can see the output broken up into two main areas – a top section (no pun intended) and columns of system processes under the highlighted bar.
Unfortunately, the output shown above is on my demo Cloud Server so there isn’t a great deal happening. Your Cloud Server may be very busy and look quite different.
Details
The very first line gives uptime and load. In this case my demo Cloud Server has been ‘up’ for 5 days, 18 hours and 49 minutes. Next to that is the load average. Mine is at 0.00 over the past 5, 10 and 15 minutes. We’ll talk more about loads in a later article.
The next line summarises the task list – this is pretty sedate on my Cloud Server.
You may well recognise the next 2 lines from the Memory Management with free article – it’s part of the KB output from ‘free’. Note the output says I only have 10388k free but this figure does include all cached and buffered memory.
Columns
The column headers summarise what the column represents. In this introduction, we will concentrate on %CPU and %MEM. Self explanatory but one shows the CPU usage as a percentage and the other Memory usage.
Let’s customise the output a bit and look at the top 10 processes only. We do this by pressing ‘n’ and then the number of processes you want to look at. In this case enter the number ’10’ and press enter:
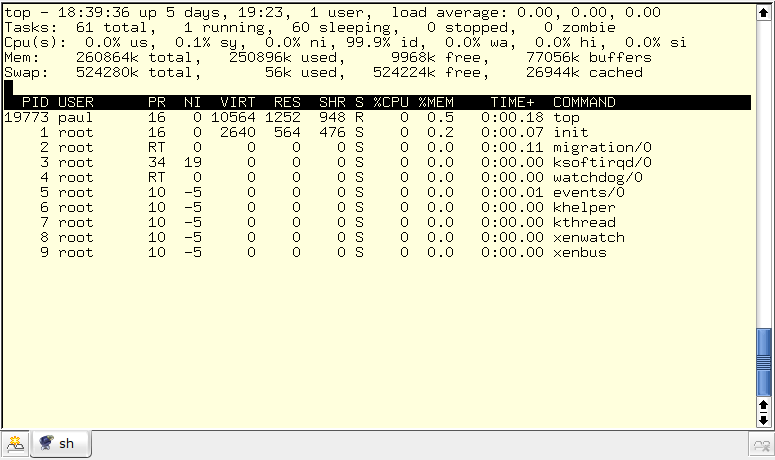
That’s a bit more sane looking.
Memory
However, we want to specifically look at the memory usage as the ‘free’ command may have told us that we are using a great deal of memory. This can be accomplished by pressing ‘Shift’ and ‘m’ (for ‘memory’).
Notice how the %MEM column is now the ‘master’ column:
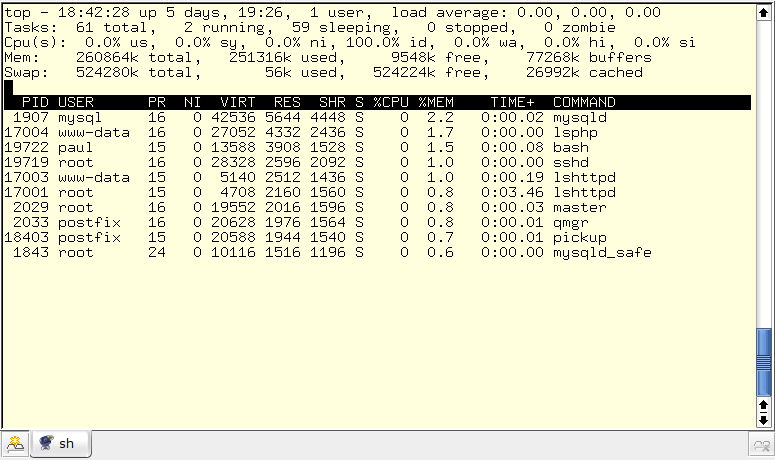
Well, mysql seems to be taking the most memory followed by lsphp (lsphp is the Litespeed Web Server PHP process). Each process has a separate entry so if there were 20 lsphp processes running, there would be 20 entries. It’s not a combined result.
CPU
Well, not much is happening there but we still want to check the CPU usage and, more specifically, what process is using the CPU and how much.
We start this process of choosing which field (column) to study by pressing ‘Shift’ and ‘o’ (the letter ‘o’, not the number ‘0’):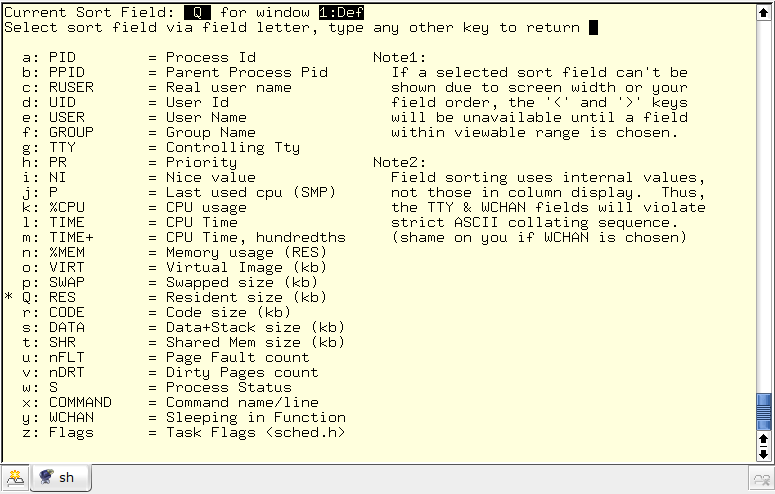
This rudimentary interface shows what processes are available for inspection. The left hand columns show a letter, the column code and a summary of that code.
Scan down the list to:
j: P             = Last used cpu (SMP)
k: %CPU    = CPU usage
l: TIME       = CPU Time
We want to concentrate on CPU usage so press ‘k’ (note how the asterisk (*) moves next to the ‘k: %CPU’ row indicating the CPU field has been selected) and then press enter.
Now we’ve returned to the processes page and the %CPU column is the ordered field.
As you saw from the interface page (‘Shift’ and ‘o’) there is a lot of scope for monitoring exactly what is happening on your server. Also, as top automatically updates every 3 seconds, you have a quick and easy real-time overview.
Favourite view
If you are anything like me, you will have a favourite view. My default view is 20 rows with the %MEM column being the master field.
To save your chosen default press ‘Shift’ and ‘w’. That’s it.
If you are quick you will see a message as follows (Wrote configuration….):
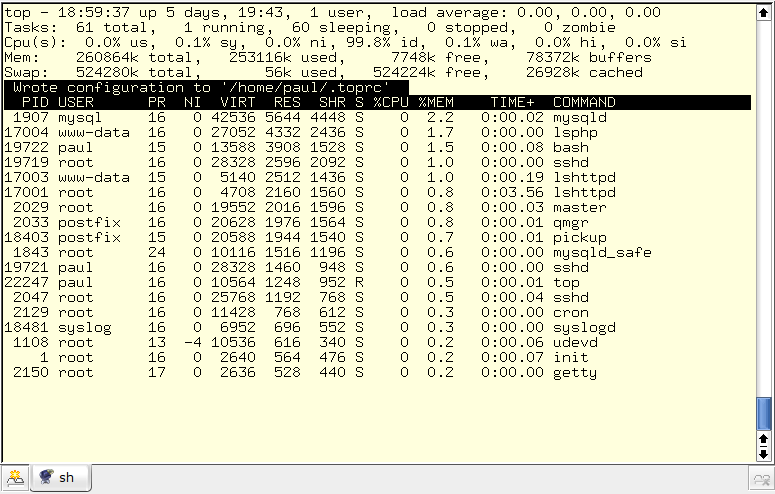
As shown, my favourite configuration has been saved to .toprc in my home directory. Nice.
Test
Let’s test this by quitting top (press ‘q’) and restart it. It should go straight to your saved configuration.
Naturally, all the options are still available to you so you’re not ‘stuck’ with your saved view.
Documentation
As with most commands, there is far more than an introduction could demonstrate.
To find out more try entering:
# man top
Although you may think the man entry seems to be ridiculously large, just take it a section at a time. I find it useful to locate what I do know, get used the syntax and then try to extend my options.
Although future articles will concentrate on more advanced monitoring tools never dismiss the simple and straightforward commands like ‘top’ and ‘free’.
Views: 0
